Between November 21st and 22nd, the price of Bitcoin fell around 15% to 6800 USD, the lowest since May. As we pointed out at Coinrule recently, the drop followed weeks of uncertainty and increasing pessimist mood among traders and investors. To understand better where we are heading to, we need to take a step back to analyse how we got here.
Let’s now have a look at a multi-timeframe analysis of Bitcoin.
Looking at the weekly chart, we can recognise four consecutive red candles that occur soon after the other four negative weeks between August and September. Interestingly, this never happened not even during the bear market. We need to go back to 2015 and 2016 to spot a similar pattern. By the way, those were the very early stages of the new bull market.
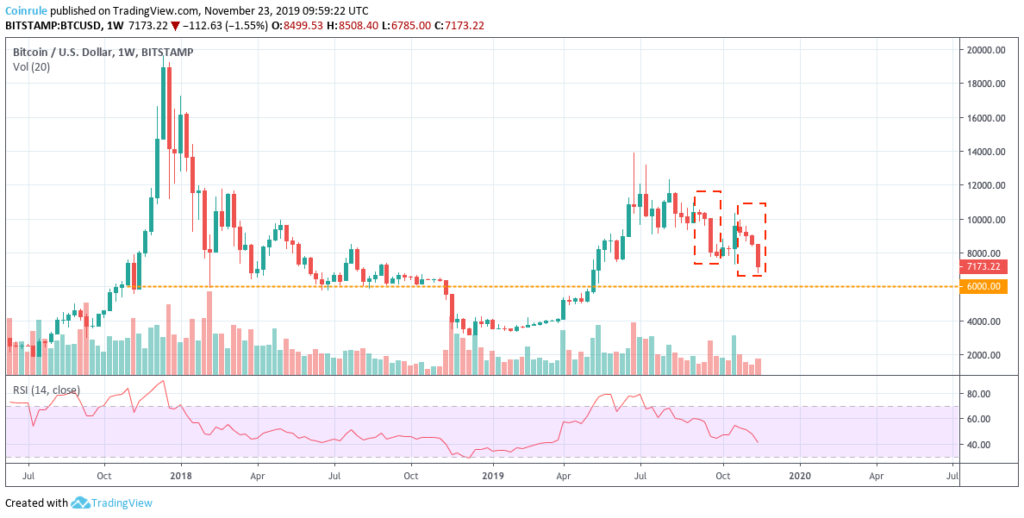
This intense sell pressure pushed the price across all the significant support levels. Only the most important is still there, yet to be tested.
The 6000 USD mark held as a support for one year between 2018 and 2019, and, when broken, back in November 218, the price took five more months to clear it again. No wonder why the market is now closely looking at it as the next and more likely target.
Too High, Too Soon?
In case of an uptrend, the general confidence in a trend grows when the price tests a critical support level and then reverts to the primary direction. That didn’t happen after the 20% price jump on April 2nd. The price shot basically directly to 14000 USD. From the breakout to the local top we can find eight green and only four red candles.
After the local top in June, the price started trading lower, marking sequential lower highs. At first, Bitcoin found support around 9400, and after breaking lower, began forming a “falling wedge” pattern. The slow “bleeding” lead to a sudden 40% price jump coupled with an RSI bull divergence. It seemed that the limbo was over, and the market was ready to head higher again.
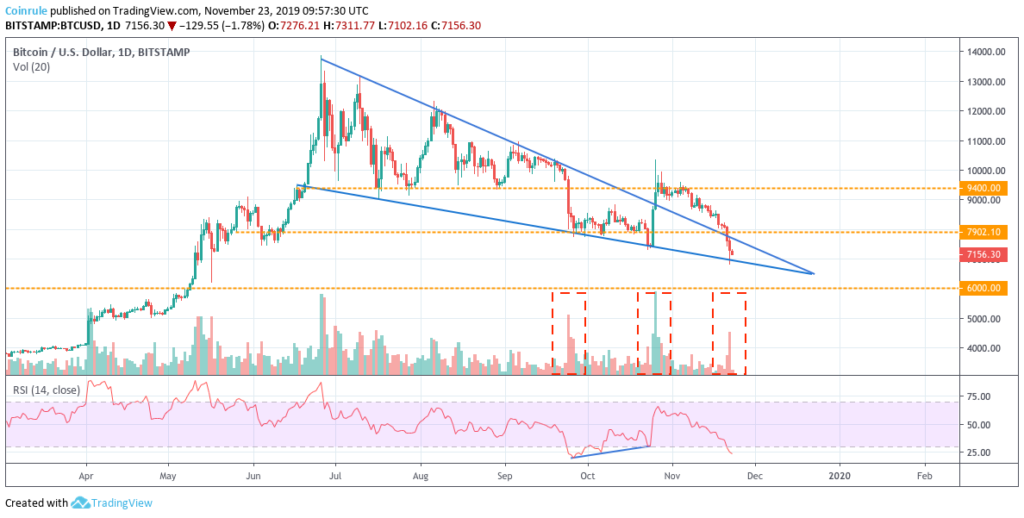
One element was missing, though. A clear breakout of a previous resistance followed by a successful retest. The market first didn’t make it to close immediately above 9400 USD and in the following days struggled to secure that level. That was the first worrisome sign that the trend could deteriorate soon.
The decline brought back the price inside the falling wedge pattern and significantly accelerated in the recent days, only to stop (for now) with a precise tag of the downtrend on high volume. That is a further confirmation that the market is closely looking at this formation developing. The verge points at 6400 USD, just around 6% above the main higher time frame support.
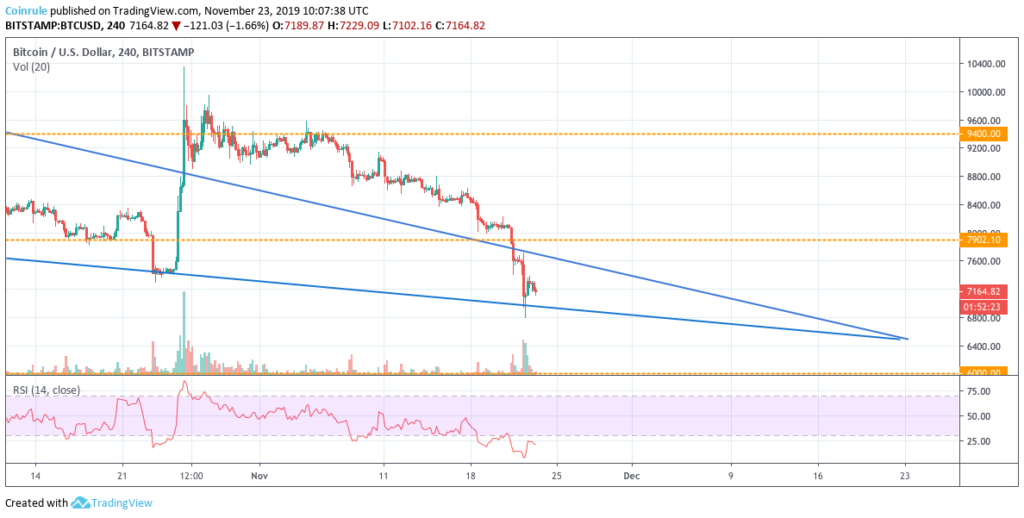
While the base case scenario for bears has a first price target of 6400-6000 USD, what could provide evidence of a trend reversal?
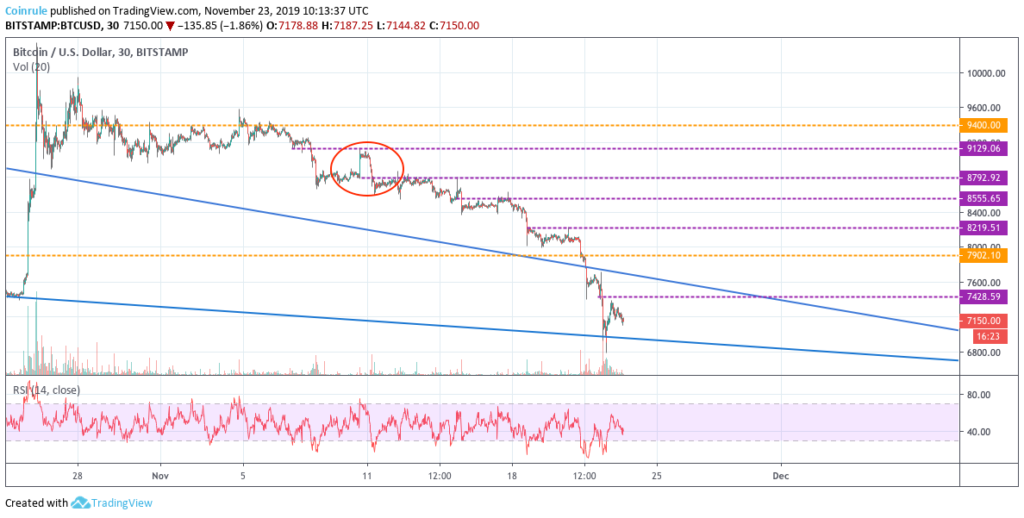
In my view, the first thing that bulls should look at is a shift in the price action around support/resistances, as we witnessed it in the last weeks. Every time a support level was broken, the price tried to regain that level, just to fail and drop further after that.
From this point of view, I identify the main sell-signal in the red circle. The price attempted a rebound above the resistance, and it was instead rejected clearly. In the same way, I would recognise an initial buy-signal whether the price manages to break (and eventually, successfully retest) one of the purple horizontal lines.
Watch Out For Price Manipulations
A friendly reminder, the crypto market is still a relatively illiquid market that big players can move in the direction that can maximise their profit. Admitting that doesn’t mean to accept a “conspiracy theory”, but helps understand better the dynamics that govern the major market moves. And every time you build a trading plan with Coinrule, that should take into account these dynamics.
When price breaks a key level, a FOMO buying-rush starts among small/retail investor and traders. But if the trend is not supported also by larger/institutional players, as the price moves higher, it becomes simple to push it back lower with relatively large sell orders.
That is the reason why I always look at the volume when analysing a price chart. Fortunately, it’s difficult for big players to hide their footprints.
What do I expect then? The price is currently way oversold, at least a short-term relief is very likely. 7400 will be eventually the first occasion to test the bulls’ spirit, but only above the 8600-9000 area, the uptrend will be able to continue with more confidence.
If that doesn’t happen and the price keeps heading south, there are good chances to meet the lower 6K quite soon. And in my view, it wouldn’t necessarily represent a catastrophe. As we said, Since the April breakout the market didn’t test that level again. If the price finds there significant liquidity to push it back upward, it will represent a reliable confirmation that finally a bottom is in.
Final Remarks Looking At The Fundamentals
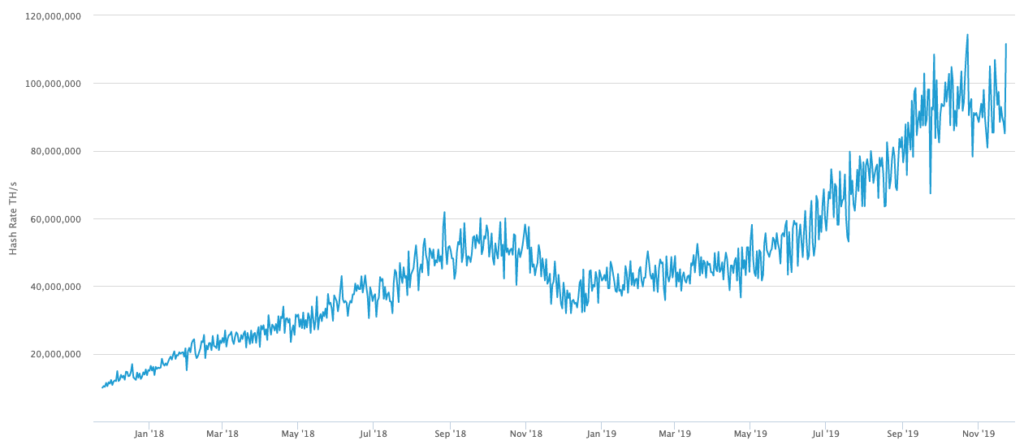
We had a close look at how the price evolved over the last months. Unfortunately, often, the price is a liar and doesn’t actually reflect the value of the asset directly. One of the most important metrics that investors should look at to gauge the state of the Bitcoin network is undoubtedly its Hash-rate.
Looking at the data, we observe that we are at all-time high values well above the 100 Million TH/s mark that was broken for the first time only recently in September. The network, from this point of view, looks more secure than ever, and miners keep pouring investments in the business.
What about the near future? The most awaited halving is approaching. On the one hand, it’s impossible to calculate how much the Bitcoin is already pricing in this event. On the other hand, the real impact of the halving has still to impact the current demand/supply structure of the market.
If we assume that miners are among the largest sellers of Bitcoin daily, as the need to hedge from the price volatility, it’s also safe to foresee the stock of Bitcoin available-to-sale will reduce drastically when the halving occurs. If demand keeps growing as mainstream adoption will spread, that will create an unbalance between demand and supply as it is now and the price will be automatically pushed higher.
It’s important to stress that shake-outs, where weak hands sell to larger buyers, are the standard in all traded markets. But they usually anticipate a new move up.
Look at the bigger picture!
..are you ready for the next big move?
Create your rule now!