Category
- Trading Strategies
- Get Started
- Exchanges Guidelines
- Trading Tips
Hedge Link Correction- Ep 23
Market Analysis
Comparing the current Bitcoin chart against the Bitcoin chart from August to September, we see that the price tested the key resistance level of $12,000 several times. A few episodes back, we had said that the $12,000 is key resistance, and once it is broken, we will have the momentum to propel us to $20,000. This is exactly what happened, after a consolidation period, Bitcoin broke the $12,000 resistance and jumped to levels close to $20,000.
The $12,000 was the previous local top in 2019; the market was looking at this key reference point to see if Bitcoin had the momentum to break this price. Similarly, the levels of $20,000 are the All-time highs, once broken, Bitcoin will go into price discovery. Before this can occur, we will need to break a critical supply area; there are many sellers at the price of $20,000.
The similarities in the graph and the similarities with the demand and supply scenario allow us to draw a close comparison between the two instances. Naturally, supply and demand transpose to price action; we anticipate that there will continue to be sideways movement similar to the accumulation period we experienced in August.
As we advance, we anticipate that the price will continue to trade sideways for a period of time before breaking the $20,000 resistance level. Furthermore, we anticipate a high probability that there will be a pullback in Bitcoin’s price, creating the perfect “Buy Zone” before a parabolic increase in price. To take advantage of these market opportunities, we will continue to run our BTC hedging strategy that we have previously discussed.
Having a hedging strategy in place can mitigate risk exposure and help practice sound risk management. It is always vital to remember that there is an inherent risk while trading and that you should never risk more than you are willing to lose.
Here is an example of a successful strategy launched during the week.
How to build a suitable strategy
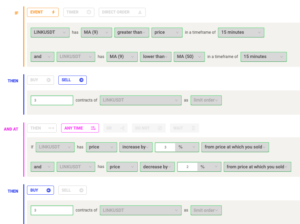
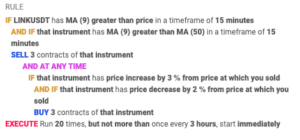
Short sell ChainLink in a downtrend
The rule is structured in a way that it opens a short position on ChainLink if the MA (9) is lower than MA (50) and if the MA(9) is greater than the price in the same timeframe. Doing this allows us to hedge a portion of our risk, taking advantage of occasional short-term corrections.