Not only do technical indicators allow you to make the right decision at the right time, but they also help you to maximise your returns while minimising your risk. This article will discuss the 5 best technical indicators for day trading that you must take into account. So, let’s get started.
A technical indicator is a pattern signal or mathematical calculation that provides valuable insights regarding stocks and other financial instruments. In trading, indicators are some of the most critical tools that can help you make the most informed decisions to capitalise on opportunities.
Moving Averages
In simple words, a moving average is a calculation of a security’s average price. It’s measured by averaging out the security’s prices over a specified period. The primary purpose of this technical analysis is to provide you with the information to understand whether a security is in a downtrend or an uptrend. Day traders use moving averages to improve their odds of success by gauging market trends and changing their trades in the market direction. There are multiple moving averages, such as SMAs (Simple Moving Averages) and EMAs (Exponential Moving Averages).
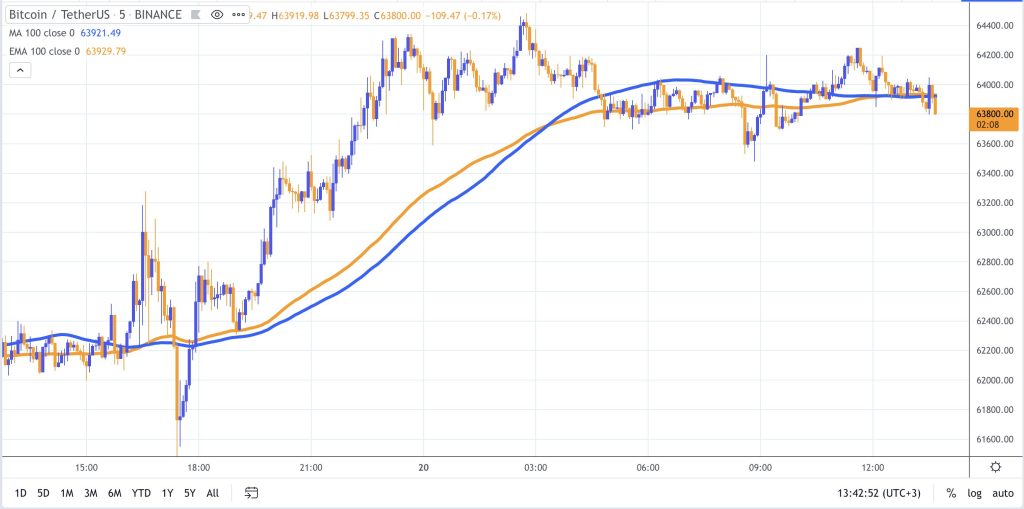
Using SMA with the combination of 5-bar, 8-bar, and 13-bar is considered to be a perfect fit for day traders. These moving averages are one of the most commonly used technical indicators, and they’re based on Fibonacci settings.
Benefits of Moving Averages
- Offer information regarding the momentum of the market.
- Allow traders to understand the market trends.
- Provide information regarding stop loss and the most appropriate stop-loss points.
- Offer great trading opportunities to maximize profit in the market direction.
Relative Strength Index
RSI stands for relative strength index, and this technical indicator offers information about oversold or overbought conditions. It was created by J. Welles Wilder Jr. and allowed you to calculate the underlying asset’s price momentum. According to the RSI indicator, if an asset has a momentum of 70 on the scale from 0 to 100, it indicates that the asset is overbought. On the other hand, if the momentum is reaching 30, then it’s a sign of the asset being oversold. Using the RSI, the trader finds opportunities to buy or sell.
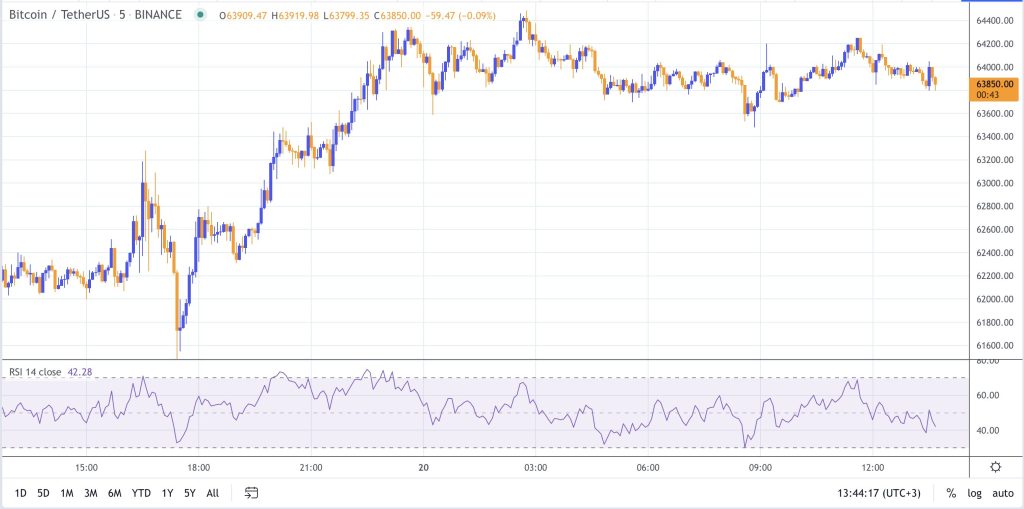
It’s important to note that there have been many refinements in RSI over time. One of the most popular ones is done by Constance Brown. She explained that in the upward-trending market, the level of oversold is higher than 30, and in the downward-trending market the level of overbought is lower than 70. That’s why RSI offers the best results when it conforms to the trend of the asset’s price.
For instance, if the price trend is bearish, then you should consider bearish RSI momentum signals and if the price trend is bullish, then ignoring those RSI signals is better. Read more about strategies you can create using the RSI.
Benefits of RSI
- Provides information regarding the general trends of the market (if it’s below 50, the market trend is downwards, and if it’s above 50, the market trend is upwards).
- Allows you to understand oversold and overbought conditions.
- Helps you to find buying or selling opportunities.
MACD
MACD (Moving Averages Convergence Divergence) shows the relationship between 2 different moving averages of the price of an asset. It’s a momentum indicator that is measured by subtracting the 26-period EMA (Exponential Moving Average) from the 12-period EMA. It consists of 2 different chart lines and indicates the asset’s average price. However, unlike other moving averages, it gives the highest weightage to the most recent prices as compared to further-out ones.
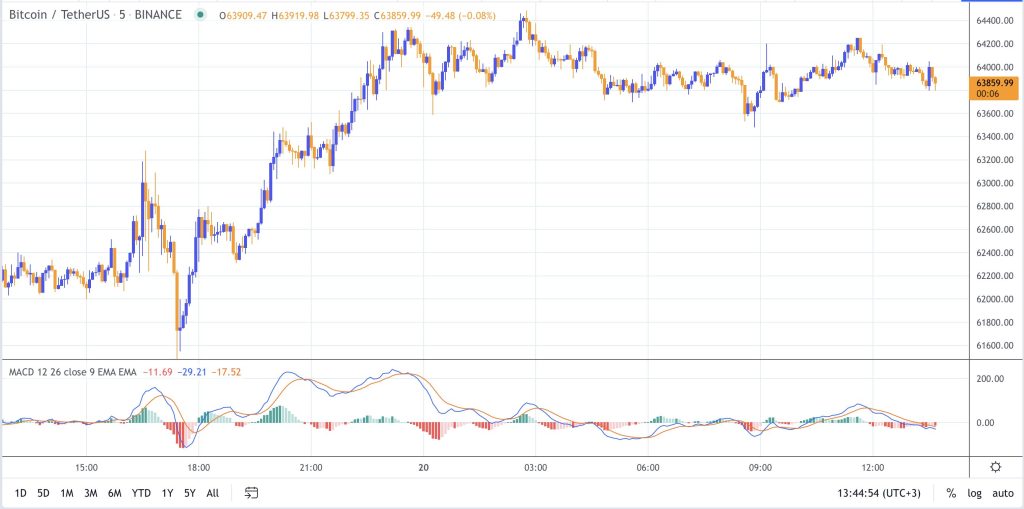
The signal line of this indicator is basically a 9-day EMA that works as a trigger for buy/sell signals after being plotted on the top of the first (MACD) line.
The MACD line signals a bearish trend if it’s below the signal line and shows the bullish trend if it’s above the signal line.
Benefits of MACD
- Allows you to identify the direction of short-term trends quickly.
- MACD is very easy to read as compared to most other technical indicators.
- Provides you with the information as to whether the bearish or bullish price movement is weakening or strengthening.
Bollinger Bands
Bollinger Bands is another great technical indicator for day traders, and it was created in the 1980s by John Bollinger. At that time, it was believed that the volatility was static, but Bollinger Bands showed that it was dynamic.
This technical indicator consists of three different bands known as upper, middle, and lower bands. The middle band works as the moving average, and the lower and upper ones are set below and above the middle one. The positioning of the upper and lower bands represent volatility and are determined by a customisable number of standard deviations of the asset’s price.
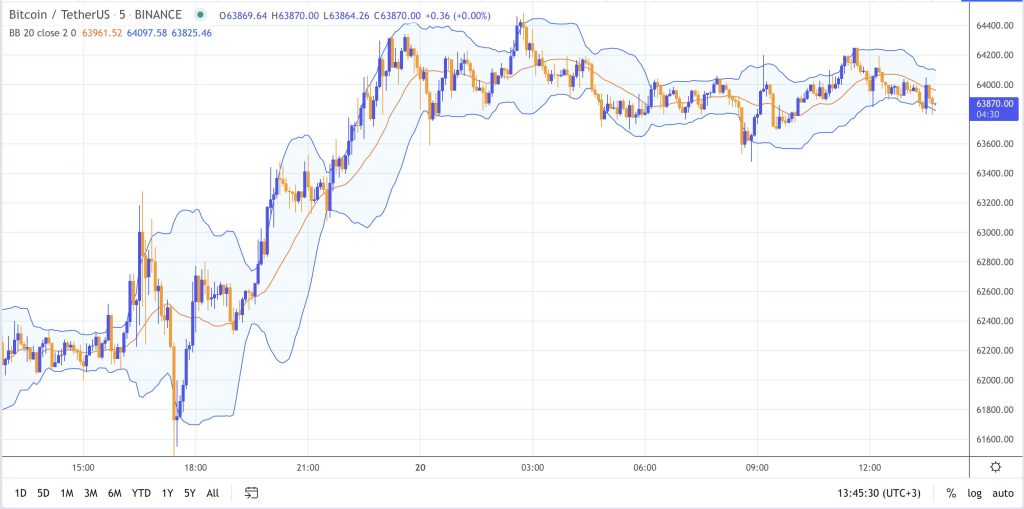
The general purpose of Bollinger Bands is to provide the traders with information reading the asset’s price. It allows you to understand whether the asset’s price and volatility are relatively high or relatively low. You can gauge relative price by comparing the position of the asset’s current price relative to the bands. Charles Schwab added another feature to this indicator, and now the width of the band provides real-time, visual information about the asset’s volatility.
Benefits of Bollinger Bands
- If the bands are wider, the volatility is high. If the bands are narrower, the volatility is low.
- Allows you to identify whether the asset’s price is high or low on a relative basis.
- Provides you with the expected “normal” volatility/range of price action to identify breakouts.
5. Price, the layer-1 indicator
Last but not least, our list of the 5 best technical indicators for day trading includes the price. At the end of the day, indicators are derivatives of the price. That results in a lagging effect that delays the buy or sell signal. Looking directly at the price action of an asset will give more prompt triggers for orders.
Support/resistance levels, and pivot points. The current and historical price of an asset also provides some valuable insights that day traders use. Here’s how you can use price as a technical indicator.
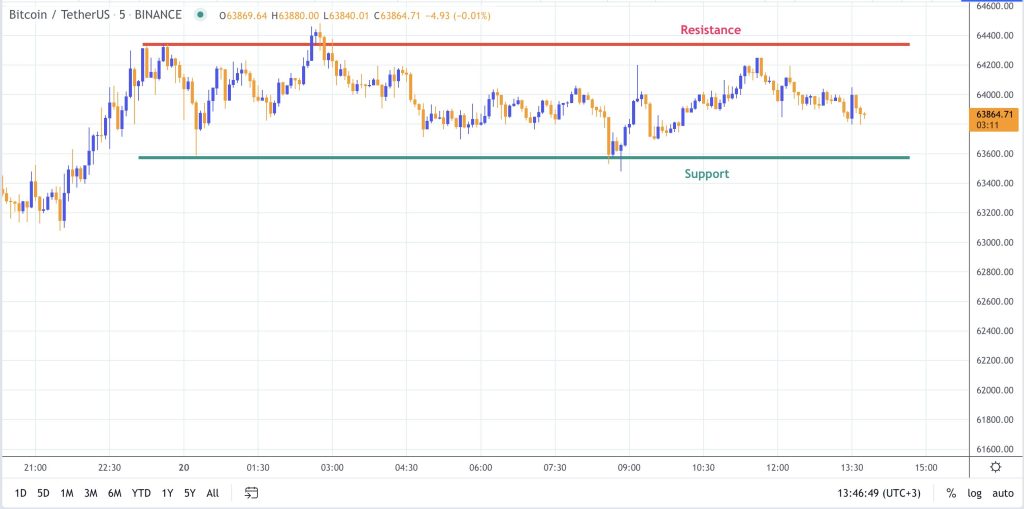
Support
A support level/line is a technical indicator that determines the asset’s price point where it can potentially find support after falling. In simple words, it provides you with information on whether an asset will recover or not.
Resistance
It’s just the opposite of the support level and provides information about the price point of an asset where it will meet resistance as it rises. In other words, the price of an asset usually falls after reaching the resistance level.
Pivot Points
Support and resistance levels are not set in stone. If the price breaks through in an unexpected direction, the support level could “pivot” into a resistance level, and vice versa. These are also very valuable indicators to trade on, as they represent strong reversal’s in the market’s psychology regarding a specific price point. As a general rule, the longer it takes to break a level (support or resistance), the stronger the new, opposite, pivoted level is.
Conclusion
These are the 5 best technical indicators for day trading. What makes them ideal over others is their simplicity and intuitive appeal – it doesn’t take long to pick them up, but mastering them can take years and is a very rewarding challenge. Furthermore, most of the “more complex” indicators are built on top of these foundational ones, so as a trader, you’re essentially getting the same signals always.
Of course, when it comes to financial markets, nothing is guaranteed, but such tools help you tilt the odds in your favour. Over the long run, and with enough trades and proper risk management, using technical indicators for day trading can simply improve your returns and help you outperform the market.