Sometimes, to get a 360-degree view of the current conditions of the crypto market, a single chart is not enough. By combining Bitcoin’s price trend and its dominance over the rest of the cryptocurrencies, you can get insightful information about where the market is going next.
The charts of Bitcoin’s price and Bitcoin’s dominance provide a helpful overview of how the capital is flowing across the crypto market. As it’s commonly said, follow the money.
There may be four main scenarios that can happen. Identifying them will provide you with a clue about the ongoing dynamics.
“Bitcoin is the King“. When both Bitcoin price and dominance go up, this is a sign that capital is leaving Altcoins to be reallocated into Bitcoin. That usually happens when the Bitcoin price breaks key resistances and starts parabolic growth. Altcoins are not able, as a whole, to catch up with such price growth, underperforming Bitcoin in relative terms.
“Crypto-euphoria“. If the Bitcoin price increases while its dominance drops, that means that there’s an influx of new capital into crypto, most of which flows into Altcoins.
“Mild correction“. When the euphoria starts to cool off, it’s always Bitcoin leading the way. At first, when the market expects just a transitory pull back, investors and traders try to hedge and get an additional return from Altcoins. This way, as a whole, their price drops less sharply than Bitcoin.
“Panic selling“. When Bitcoin’s drop gets severe and the dominance increases, that means the market is moving out of Altcoins and seeking relative safety in Bitcoin. That usually signals the point of max pain in the market, which also may represent the best buy opportunity.
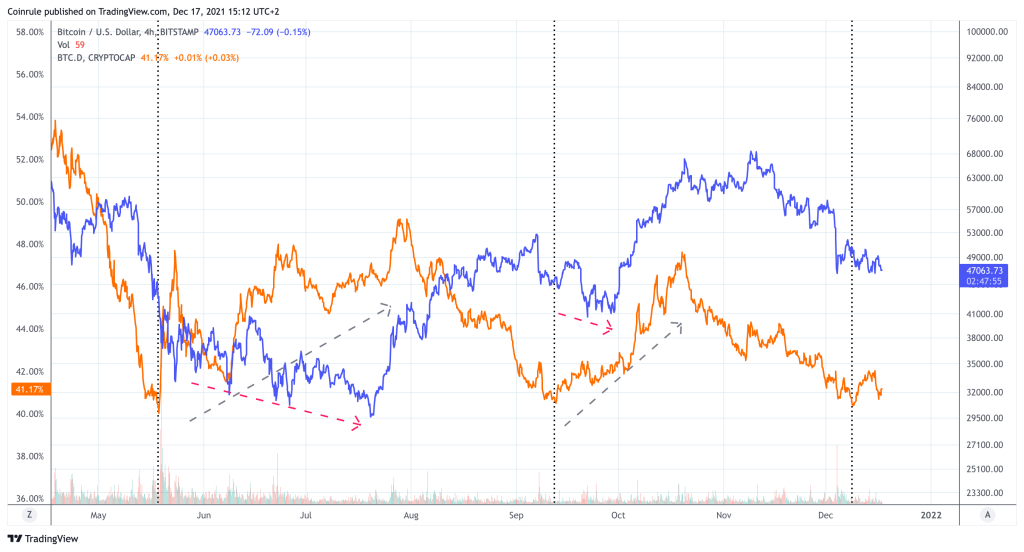
Looking at the chart below, you can see that the last two times Bitcoin dominance bottomed, that came at around halfway down during the current correction.
That happens because investors start to worry about the increasing likelihood of further downside.
Around late July, Bitcoin’s price rallied without a matching rally in its dominance, implying this was the risk-on phase for Altcoins. As Bitcoin started to consolidate for a couple of months, Altcoins had more upside.
Again, in September, investors rotated capital into Bitcoin. In the beginning, they did so to hedge from the risk of a more sustained downtrend. Then, with Bitcoin rebounding strongly, the market expected a parabolic run to new all-time highs for Bitcoin.
What was one of the main signs that the uptrend was not sustainable at that time? Capital flew again into Altcoins. There was just not enough demand focusing only on Bitcoin to push it higher. The market lost steam, and, eventually, the trend reversed.
Why is this relevant?
Understanding where capital is flowing helps you manage the risk of your portfolio better. That provides you with valuable guidance about how to allocate your funds to create value with all market conditions.
The chart tells us two different stories. First, Bitcoin is hovering around critical support. The price could drop at least 5 to 10% from here if this is broken. On the other hand, despite the widespread uncertainty, Altcoins are still priced at historically high valuations compared to Bitcoin, leaving them particularly vulnerable in case of significant Bitcoin volatility, both on the upside and downside.
The good news? Managing your portfolio automatically in all market conditions has never been easier with Coinrule.
Trade safely!