Once a trader from a large forex trading desk explained his main trading daily routine.
He started his day placing a large order to test the closest price resistance, waiting for the market to react. If the market moved in the direction of his trade, he was happy with a nice profit. On the other hand, if the resistance proved to be solid, he would have closed the previous trade with a small loss and opened a new one of double the size in the other direction. Eventually, the profit could have been even larger.
No matter what asset class you are trading, the basic principles of demand and supply are always the leading indicators to understand where the trend is heading next.
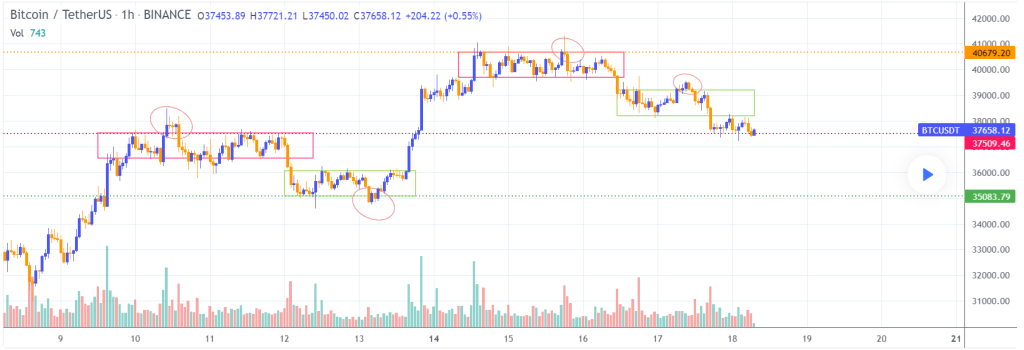
Looking at Bitcoin’s chart, this applies perfectly. The price has been moving with relatively low volatility for over one week now. The moves may seem random, but they make a lot of sense at a closer look. The price tends to consolidate into tight ranges, which are tested frequently. Once a breakout occurs and fails, that is the signal that it will likely move in the opposite direction.
Once you break out the price action into blocks, it becomes easier to understand how supply and demand are distributing.
Remember, the price eventually chases liquidity, so take your position in the direction of the liquidity areas, and plan your risk management accordingly.
Trading such choppy market conditions may be stressful and frustrating. The good news is that automated trading may add more value to your portfolio, especially in these times.