Technical analysis is a handy tool for traders, but the truth is that it’s not an exact science.
If it were, reading a book would make you a professional trader. Chart patterns may appear different to the eyes of each analyst based on their biases. The first step is to try setting aside as much as possible any belief you can have about where the price is heading next and focus as much as possible on objective elements. This is necessary to use Technical analysis appropriately,
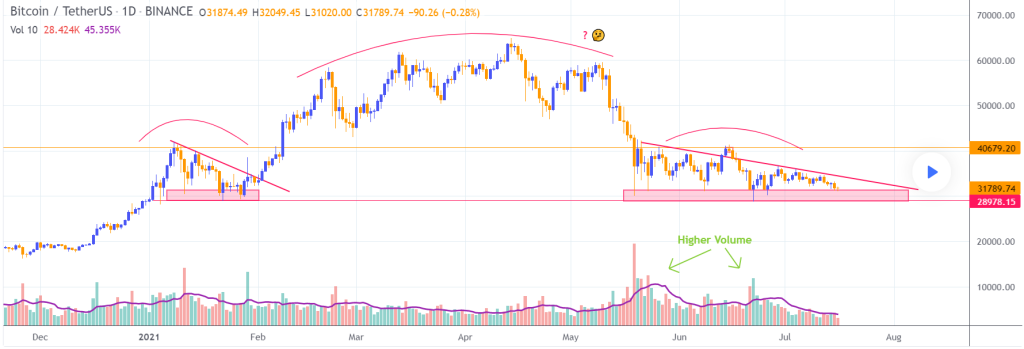
Let’s try to apply this method to Bitcoin’s chart. As time passes, the chart seems to be more likely on the verge of another significant drop. Since June, the price has posted lower highs, while the horizontal support is holding. The question is, for how long? Some traders have raised the idea that Bitcoin is building a massive head-and-shoulders pattern.
For how bearishBitcoin may look like, the good news is that this is not an H&S formation. The “head” is atypical, but what is even less common is how the volume develops. To be a valid H&S , the volume should be higher on the left shoulder and decreasing after that. Conversely, Bitcoin’s volume has been higher on the right shoulder, indicating high interest both for buyers and sellers around those levels. Another good news is that Bitcoin broke up from a similar accumulation period at the beginning of the year.