Technical indicators are, without any doubt, the most exciting tools traders use. The general idea is that they are very complex and to some extent, that is probably true, and it’s challenging to manage them with manual trading. Technical indicators and crypto trading match perfectly with an automated trading system. A trading bot can process a massive amount of data 24/7, increasing the effectiveness of your performances significantly.
We are thrilled to announce that now you can build your automated trading bot in a few steps and run it on Moving Averages and Relative Strength Index (RSI) indicators.
How Do Technical Indicators Work?
Using technical indicators means to adopt the theory that prices move with recurring patterns. Therefore, these patterns incorporate all the information required to operate a trading plan. Technical indicators don’t take into account any “fundamental value” of the asset. That fits well with cryptocurrency trading since so far there aren’t any reliable models capable of predicting their price.
Watching a chart and looking at the price moving up and down could often lead to the idea that it moves randomly without a clear trend.
At a closer look, though, it’s possible to spot predetermined behaviours that already happened in the past. This is precisely what technical analysis tries to catch. It’s impossible to foresee with a 100% degree of confidence where the price will move next. It’s possible to gauge some clues about it, though.
The crucial aspect to keep in mind at this point is that it’s always a savvy choice to employ techniques to mitigate the risk and to manage your assets in a way to prevent significant losses that could compromise your liquidity and your capability to trade in the long term.
That said, the calculation of any technical analysis requires historical prices. The time-frame of the indicator defines how the price is aggregated. In the rule page, you can select the time-frame that fits best for your trading system.
For example, if you select a time-frame of 1 day, that means that the bot will calculate the indicator using a daily price frequency. Using as an example, the Moving Average (50) with such a time-frame will correspond to the average price of the latest 50 days.
How To Use Technical Indicators?
There are different types of indicator and each of them has a specific purpose and utility. Understanding in which conditions one indicator performs better, and what signals it provides, allows users to take much better decisions while trading.
One thing to keep in mind when deciding which indicator to add to your strategy is the intrinsic lagging nature of every technical indicator. Given that the bot calculates them starting from historical data, by definition, they can provide a signal (buy, sell or some other price confirmation) only after it happened. I wouldn’t consider it a proper limitation, but just one aspect that every trader should always consider when analyzing the signals.
There are some ways to reduce the lag-effect of an indicator, but that increases the chances of getting false signals. Choosing between a smaller lag and lower precision of the indicator is a crucial trade-off the trader should assess.
Testing a strategy before launching it live to the market can help fine-tune the parameters to reach the balance that fits your needs. Remember, technical indicators are not perfect tools, and they shouldn’t be either. After all, catching the absolute top or bottom of each price swing is virtually impossible. Interpreting the right direction and employing the proper risk management tools makes a trader into a Pro.
How To Add Technical Indicators To Coinrule?
Creating an automated trading strategy has never been easier!
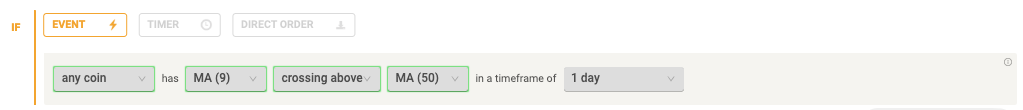
Technical indicators appear in the condition block. At the moment, the rule triggers on signals from Moving Averages and RSI.
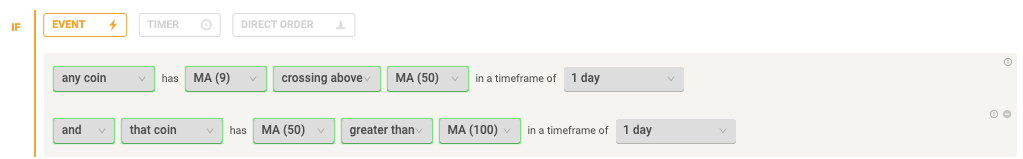
Add up to three conditions for each block, allowing maximum flexibility to achieve any trading strategy traders would need.
You may want to buy whether the Moving Averages point at a specif pattern.
Sell on sharp price increases if the RSI indicates that the trend is overextended.

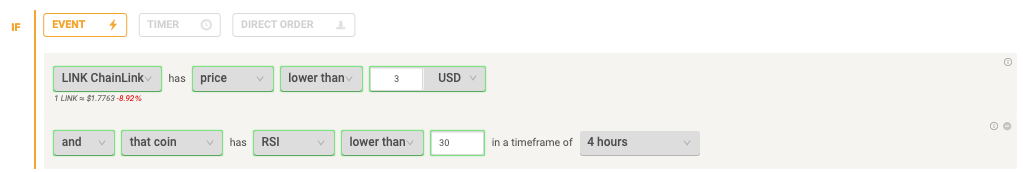
Accumulate more of your favourite coins when the price is oversold.
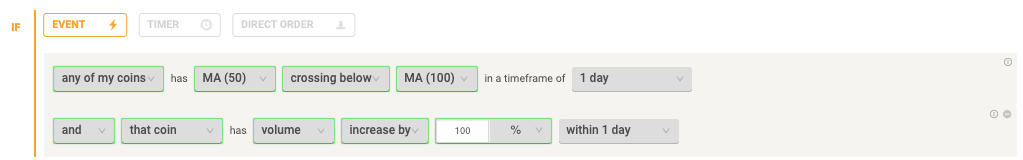
Or you could protect your wallet from drawdown if the price crosses a long-term moving average on high volume.
Whatever is your perfect trading strategy, you can now build it with Coinrule. Then, if you are curious to discover more ways to use technical indicators for your crypto trading, check out our new templates!
Your next step into automated trading is here!
Trade safe!