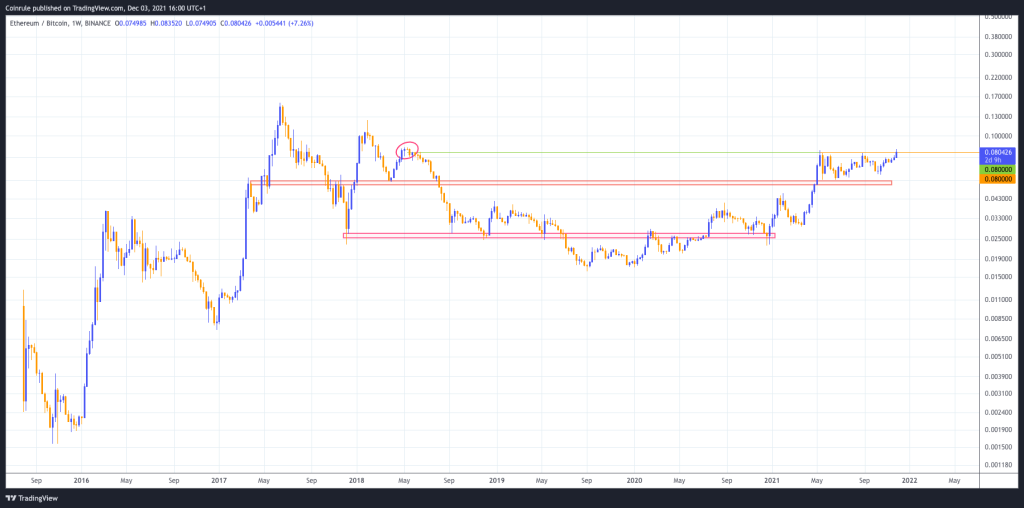
Does this look like a bearish chart? Ethereum priced in BTC is now probably the most bullish chart in the crypto market. What comes next?

Ethereum is now attempting to break a key level established back in 2018. 0.08 Bitcoin per Ethereum is the price level at which Ethereum ended the last significant rebound before collapsing into the long crypto-winter. That could anticipate a historic crypto flippening.
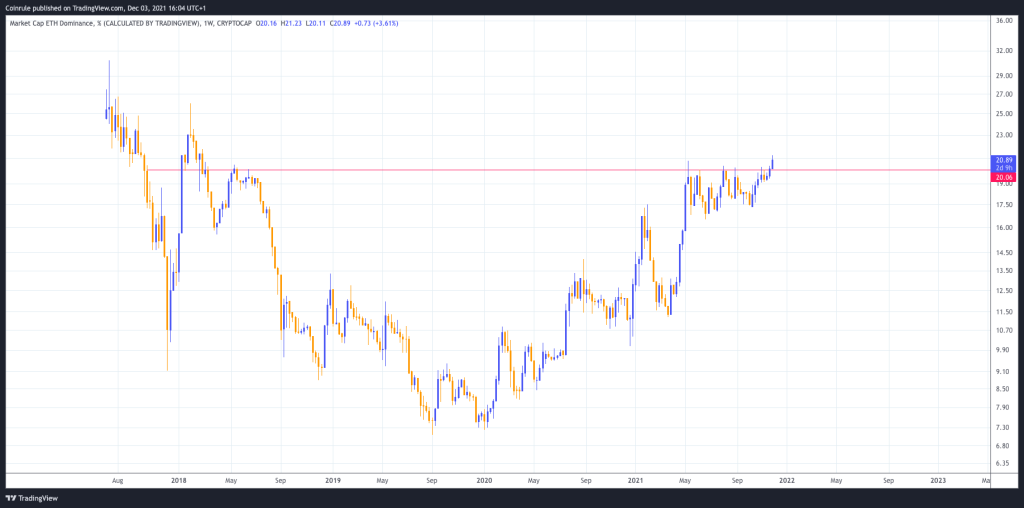
While most of the market’s attention has been focusing on new emerging layer-1 and layer-2 protocols, Ethereum has steadily gained market share. Ethereum dominance is currently the highest since March 2018.

Back then, Ethereum was mainly a vehicle for shady ICOs. Nowadays, ETH is the fuel for a new economy that locks over $100 billion of value. The Ethereum network has proven to be extraordinarily resilient to market shocks. At the same time, flexible enough to support countless use cases for dApps people actually want to use.
That being considered, the current valuation does not seem to be that overheated. Ethereum market capitalization is now around $500 billion, and at the same time, the supply keeps shrinking, with more than 350,000 ETH burned in the last 30 days alone.
While arguably the current market cycle sits at a mature stage, there may still be upside potential. It’s hard to imagine Ethereum running in an uptrend while the rest of the market drops. The buying pressure for Ethereum is undeniable, and it will likely distribute across other coins when the optimism in the market fully recovers after the recent downside volatility.
A pullback below 0.06 would invalidate this scenario. On the other hand, a confirmed breakout will project Ethereum to overperform Bitcoin by at least 50% in the short term.
As a reminder, if Ethereum doubles the market cap versus Bitcoin, that would make ETH the most valuable cryptocurrency, dethroning King-BTC and completing a crypto flippening that was unthinkable years ago.
