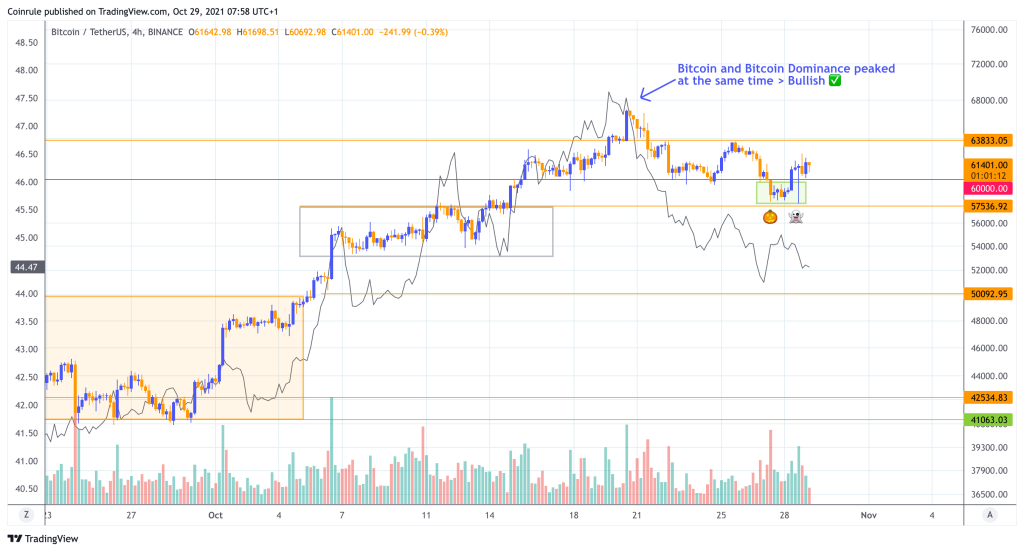
Halloween is that period of the year when streets are full of ghosts and monsters. At a closer look, they are just kids asking for candies. If you look closely at the latest Bitcoin Halloween dip, you will find many bullish elements as well.
As anticipated, the market was looking for a retest of the first support area. During a retest, the magnitude of the price move does matter! This week Bitcoin dipped below the psychological level of $60,000 just to find another support right above the previous consolidation area.

The price then rebounded back above the breakout level. This kind of price action implies a solid amount of buyers and demand. On the other hand, sellers may not have been satisfied by such a meagre drop from the all-time high. Should they manage to push the price to a new lower low, that would open the door to a more severe drawdown that will allow them to buy back at more convenient prices. The fight is on, and it could lead to a period of sideways moves between $57,000 and $64,000.
What about Alts? They will undoubtedly be those that will benefit the most from this scenario. The rally of Altcoins in BTC prices started precisely at the top of the latest Bitcoin run. As the trend began to weaken, investors and traders rotated their allocation back into Alts.
How long will this Alt-party last? Time will tell. Meanwhile, it’s worth continuing to keep an eye on the Bitcoin Dominance chart compared to Bitcoin’s price. This is the single best indicator to optimize your portfolio allocation and boost your returns in times of lower volatility.
Bonus chart
Things happen fast in crypto, and you should be ready to catch the opportunity as it comes at all times.
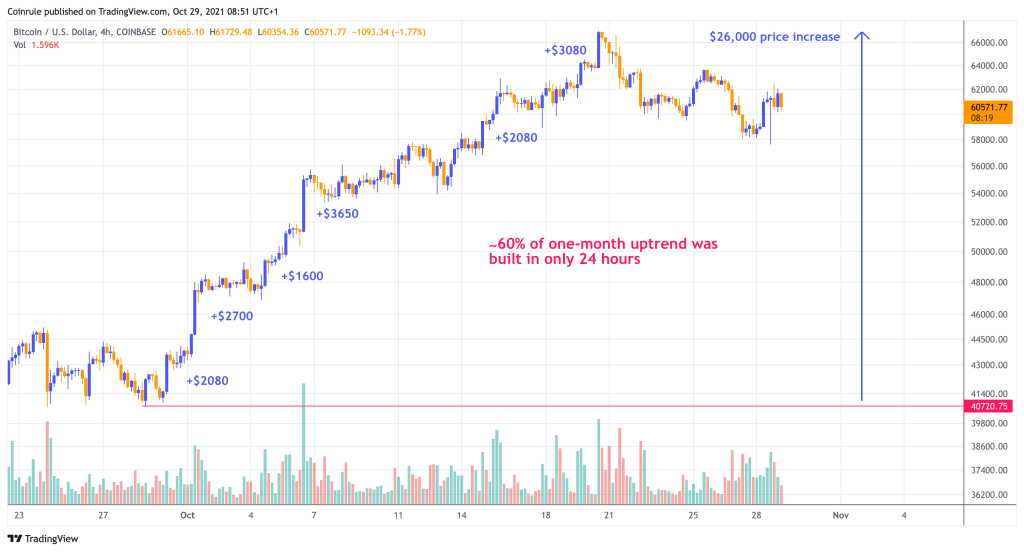
Looking at Bitcoin’s uptrend in October, from bottom to top, the price increased by around $26,000.

Looking at the data closely, the price actually mostly trended sideways. Around 60% of this run was built in only six 4-hour candles, which equals to a total of 24 hours.