On Wednesday, inflation prints (CPI) came in below expectations of a ‘hot’ print which would have likely indicated that the Federal Reserve will continue tightening rates. Cryptocurrency and equities markets reacted positively while bond yields dropped. These numbers are expected to persuade the Fed to lean more towards a “pause” stance for its next FOMC meeting in June.
Meanwhile, markets are still concerned about the debt ceiling crisis as negotiations have not shown much progress as of yet. Despite the name, this crisis is actually more of a political issue as it hinges on a piece of must-pass legislation which would allow the federal government to increase its borrowing to fund its spending obligations. The Democrats currently have control of the Senate, while the Republicans have gained a majority in the House of Representatives. As such, they have used the debt ceiling as a political bargaining chip, pushing for cuts on what they deem as “irresponsible spending”. Unless a compromise is reached, it’s likely that caution will echo throughout markets. Currently, the U.S. is forecast to hit its debt limit in early June. If the United States defaults on its debt for the first time in history, tens of billions of dollars in payments for Social Security benefits, payments to Medicaid providers, federal salaries, veterans’ benefits, and other programs could potentially be at risk. As a result, investors are finding it challenging to decide on a trade amidst the uncertainty surrounding the debt default and resolution. Macroeconomic theory would predict that a resolution to increase the debt ceiling would reign in government spending, thus putting downward pressure on bond yields, thereby making the purchase of bonds at the current yields more attractive. Additionally, S&P500 earnings yields currently sit around 5.5% while risk-free 3-month U.S. Treasury Bills are paying upwards of 5.17%. This makes holding stocks potentially less enticing to many investors and could serve as a rationale for shorting equities.
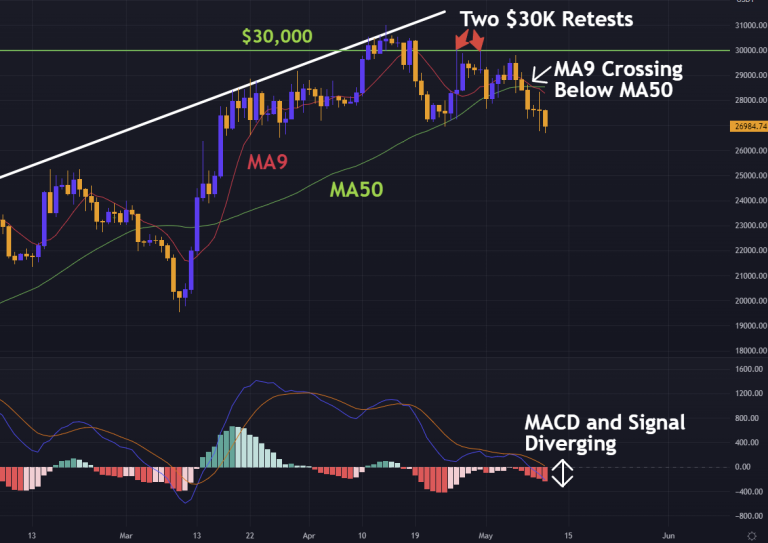
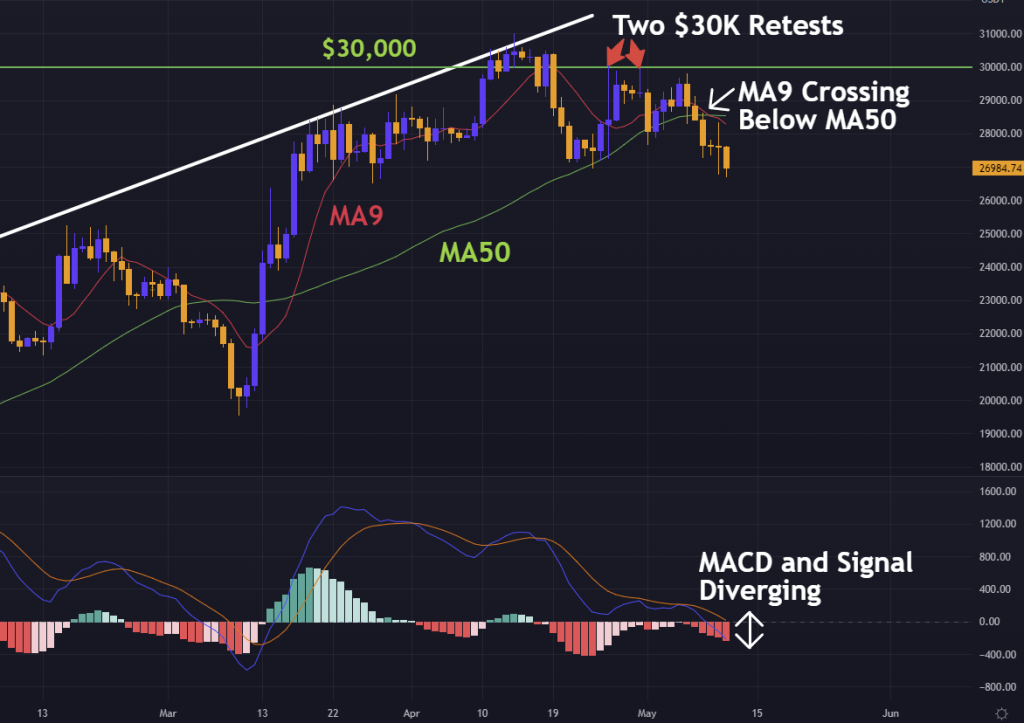
From a technical perspective, since Bitcoin lost the $30K level, it has proven difficult to reclaim. The market has tested the level twice and has so far struggled to break it. In order for the next leg up to commence, Bitcoin will first need to reclaim $30K. In our previous market update, we noted the convergence of MA9 and MA50, signalling a potential crossover. On Tuesday, that crossing finally occurred. When a fast moving average (MA9) crosses below a slower moving average (MA50), markets perceive it as a bearish signal. Another important indicator to take a look at is the MACD. Over the past week, it has remained relatively neutral. Although the MACD line has been below its signal line, the spread between them has been quite small, represented by the short bars on the histogram. However, the two lines are beginning to diverge. This is another bearish signal. The last time this happened, Bitcoin lost $30K and fell towards $27K. Although technical indicators aren’t always accurate at predicting market direction, most indicators are pointing towards an increase in bearish momentum across the crypto market in the coming days.
Finally, over recent weeks, the market has seen a variety of meme coins rally upwards. During phases of cycles, ‘meme coin season’ has often served as an indicator of a local top. Back in 2021, shortly after Doge reached its all-time high, Bitcoin capitulated from $60,000 to around $30,000. With this ‘silly season’ firmly upon us, current market sentiment feels rather frothy.