A sigh of relief could be heard resonating through the blockchain as the market’s down only streak of 9 consecutive weeks ended as the weekly candle closed green on Sunday night. This begs the question: have we found our bottom or is this a relief rally before another leg down? Bitcoin dominance has surged to 47% from the January lows of 40% – showcasing the flight to safety in the market over the past several months, or the exit of liquidity from alt coins and the crypto markets in general.
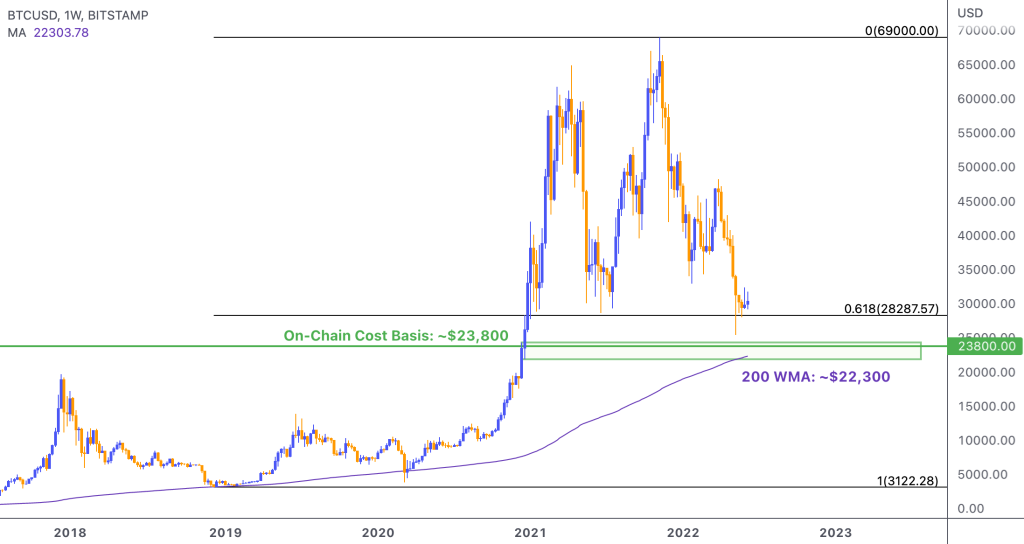
Bitcoin has found support around $28,000, this happens to also be the Fibonacci golden ratio 0.618 retracement level – a potential signal that an interim bottom has been found. However, with the Fed having started quantitative tightening on June 1st, the impact of the $95 billion worth of debt securities the Fed has stated they will sell each month has yet to be truly felt. This unwinding by the Fed will push risk assets lower as economic activity slows and liquidity shrinks in an attempt to combat high inflation.
When hypothesising where another bottom could be it is worth taking note of location of the 200 week moving average (WMA). The 200 WMA has proven to be a reliable indicator of regional bitcoin bear market bottoms. In 2015 bitcoin bottomed out and found support on the 200 WMA at approximately $200. In late 2018, bitcoin again bottomed and found support on the 200 WMA at $3,150. In the Covid crash of march 2020 bitcoin retested the 200 WMA, but briefly broke through for a week at $5,500 – ultimately reaching a low of approximately $3,800. Today, the 200 WMA sits at $22,300. Could this be the next bitcoin floor?
In confluence to the current location of the 200 WMA, the On-Chain Cost Basis of bitcoin is currently $23,800. Historically, buying in both the 200 WMA and the region of the On-Chain Cost Basis has been very attractive from a risk/reward perspective. Conversely, these times are often when it feels like crypto is finally all over and takes some serious psychological strength to press the green button. The last time bitcoin entered this region was during the Covid crash of March 2020 and ended up being a supreme buying opportunity for the investors brave enough to take it during peak market capitulation and fear, resulting in bitcoin trading below $6,000 for a week.
This week, Bitfinex longs also reached an all time high with approximately 90,000 BTC contracts equating to $2.7 billion. The previous all time high of approximately 54,000 contracts was 22 July 2021, which marked the beginning of bitcoin’s ascent to a new all time high. The question is: are these traders simply hedging having already liquidated their spot positions? Or more optimistically, are they doubling down with the expectation of history repeating itself, as they predict the tides turning and the bitcoin bottom having passed?
Regardless of if the bottom is in or more downside is on the horizon, market participants who dollar cost average at these levels will most likely experience a profitable endeavour if their time horizon is several years. As a wise investor once said “it’s time in the market, not timing the market”.