Last week, the Federal Reserve (Fed) went ahead with the 25bps hike that many expected, causing a spike in the U.S. dollar and a temporary halt to the rally that equities and risk-on assets were experiencing. This rate hike has come under scrutiny from market analysts. In the past two weeks since Silicon Valley Bank (SVB) and Silvergate Capital collapsed, there has been a multi-billion dollar capital outflow from financial institutions. The primary driver of this depositor flight comes from individuals and asset managers moving capital from low-interest savings accounts to high-interest money markets in the form of treasury bills which pay upwards of 4%. In the week of the collapse of SVB, low-risk investment vehicles that invest money in short-term government and corporate debt saw net inflows of approximately $121 billion. This 25bps hike will increase the yield of newly issued treasury bonds (worsening depositor flight) and cause the value of existing bonds with lower yields to decrease. After SVB began to unwind, the Fed announced the Bank Term Funding Program (BTFP) in order to try and limit the contagion within the economy. The scheme provides eligible depository institutions with liquidity in return for posting collateral such as under-water treasuries and mortgage-backed securities. Some market participants initially interpreted this as the Fed commencing another round of quantitative easing (QE); however, the actual mechanism is very important here. QE is the Fed’s way of injecting the most liquidity into the economy. If the Fed were actively engaging in this, the medium-term outlook would become much more bullish. BTFP collateral posted to the Fed, at least for now, must be swapped back to the bank at the end of the term and comes at a cost. So without going deep into the details, the impact on liquidity is quite different from actual QE. In reality, the recent banking crisis and the Fed’s response display that, in the short term, a pivot to accommodative monetary policy is for now ruled out. The BTFP scheme perfectly displays how monetary authorities will utilise all available measures to preserve stability during further tightening, likely meaning that a hard landing is now firmly on the cards.
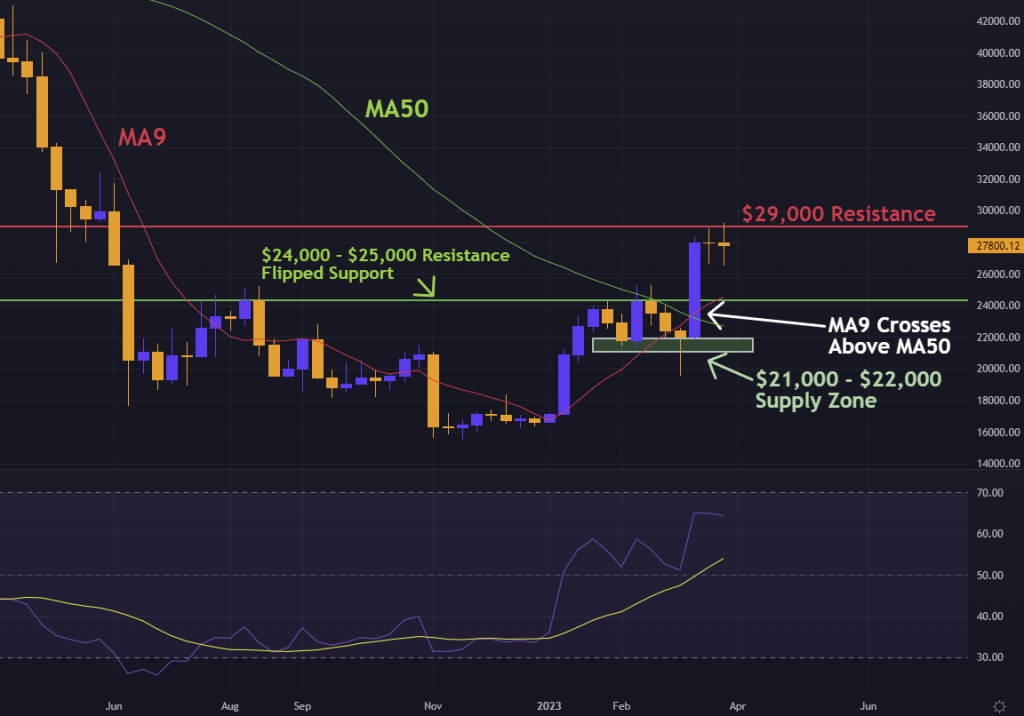
From a technical perspective, the weekly Bitcoin chart looks good. The bullish momentum from MA9 crossing above MA50 has played out as Bitcoin has rallied towards the key psychological resistance of $30K. Bulls will hope for a weekly close above the $29K resistance level, which should ignite the rally to $30K and beyond. Should this bullish momentum break down, the market will likely test the $24 – $25K support range. A fall through this would likely result in a breakdown towards the $21K – $22K supply zone, where there are presumably a lot of unfilled longs that weren’t filled before the current rally. The fact that the relative Strength Index is hovering around overbought levels indicates that the market could be primed for a reversal and supports the bearish scenario.
As we advance, the U.S. CPI data release on the 12th of April will have a bearing on short-term market direction. Soft CPI figures will provide risk-on assets such as crypto with bullish momentum while hurting the U.S. Dollar and yields. Again, volatility will be high around this time, so caution should be exercised, most notably in leveraged positions.
Check out the chart on TradingView here.