As the crypto market consolidates after a raging bull run, traders scramble to see where the chips have fallen. Lets compare ETH vs BTC
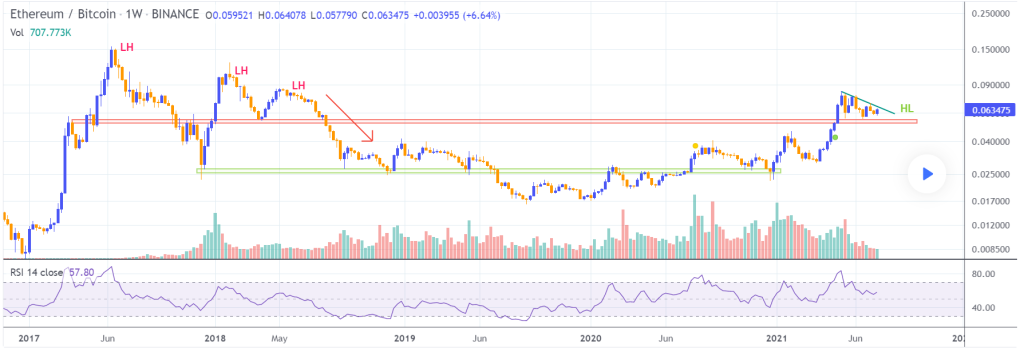
An interesting chart to look at is ETH vs BTC . Now that the initial excitement is wearing off, it is perfect for recalibrating and considering a longer-term perspective. Here, we see the last four years of the ETH/BTC chart. We see that during crypto booms, ETH outperforms BTC . However, most of the time, ETH/BTC generally trades lower than where it currently is and seems to revert to its mean eventually.
The current level is where ETH historically failed to hold onto its gains multiple times in the past. This time seems to be a different story, as the support is holding well despite the brutal recent sell-off. It’s worth noticing that the chart presents a series of lower highs during the previous cycle, while this week, the price could print the first-ever higher low above this crucial level.
On the other hand, the trading pair is still trading well below the all-time high valuations of 2017 and 2018, and that should pause caution for investors. Keeping an eye on this chart will provide valuable insights into the best time to rotate the portfolio again from Bitcoin into Altcoins.
For all investors on their crypto trading bot journey, watch out for some exciting times ahead.