
Volatility is one of the most crucial factors in trading and investing. Whether you’re dealing with cryptocurrencies or stocks, understanding how to calculate volatility can help you make informed decisions, manage risk, and optimize your strategies.
In this guide, we’ll break down what volatility is, why it matters, and how to calculate it effectively.
What Is Volatility?
Volatility is a measure of the price fluctuations that occur over a certain period. High volatility means prices change rapidly, while low volatility indicates stability.
There are two main types of volatility:
- Historical Volatility (HV) – Measures past price fluctuations.
- Implied Volatility (IV) – Estimates future price movements based on options pricing.
Why Is Volatility Important in Crypto and Stocks?
- Risk Assessment: Higher volatility means greater risk but also higher potential rewards.
- Trading Opportunities: Traders take advantage of price swings for profits.
- Market Sentiment: Increased volatility often reflects investor emotions, fear, or uncertainty.
How to Calculate Volatility in Crypto and Stocks
Step 1: Gather Price Data
To calculate volatility, you need historical price data for your chosen asset (stock or cryptocurrency). This data typically includes daily closing prices over a specific period (e.g., 20 or 30 days).
Step 2: Calculate Daily Returns
Daily return is the percentage change from one closing price to the next. Use this formula:
![]()
Step 3: Find the Average Return
Sum all daily returns and divide by the number of days to get the mean return:

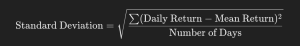
Step 4: Calculate Standard Deviation
Standard deviation measures how much each return deviates from the mean return. The formula is:
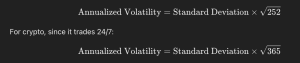
Step 5: Convert to Annualized Volatility
Multiply the standard deviation by the square root of 252 (trading days in a year) for stock markets or by the square root of 365 for cryptocurrencies:
Volatility Indicators You Can Use
If you don’t want to calculate volatility manually, several indicators can help:
- Bollinger Bands: Show price volatility using upper and lower bands around a moving average.
- Average True Range (ATR): Measures market volatility based on price range over time.
- VIX (Volatility Index): Used in stock markets to gauge overall market sentiment.
How to Use Volatility in Trading
- For Day Traders: High volatility provides opportunities for quick trades.
- For Long-Term Investors: Lower volatility assets are generally more stable investments.
- For Risk Management: Adjust position sizes based on market volatility.
Final Thoughts
Now that you know how to calculate volatility in crypto and stocks, you can make more informed trading decisions. Volatility plays a crucial role in market movements, so keeping track of it helps with risk management and profit maximization.
Would you like to see real-time volatility data? Use trading platforms like TradingView, CoinMarketCap, or Yahoo Finance for quick insights!
Follow Our Official Social Channels: