In the trading world, choosing the right indicator is essential for making informed decisions. Among the many tools available, the Relative Strength Index (RSI) is a popular and versatile indicator for traders. Whether you’re a beginner or a seasoned trader, understanding what is RSI and how to use it effectively can significantly improve your trading strategy.
In this article, we’ll explore what RSI is, how it works, its formula, interpretation, and tips to get the best out of this powerful trading tool.
Key Insights
- The Relative Strength Index (RSI) is a widely used momentum oscillator that measures the speed and change of price movements in crypto trading. Ranging from 0 to 100, it helps traders identify overbought or oversold conditions in the market, making it a valuable tool for predicting price reversals.
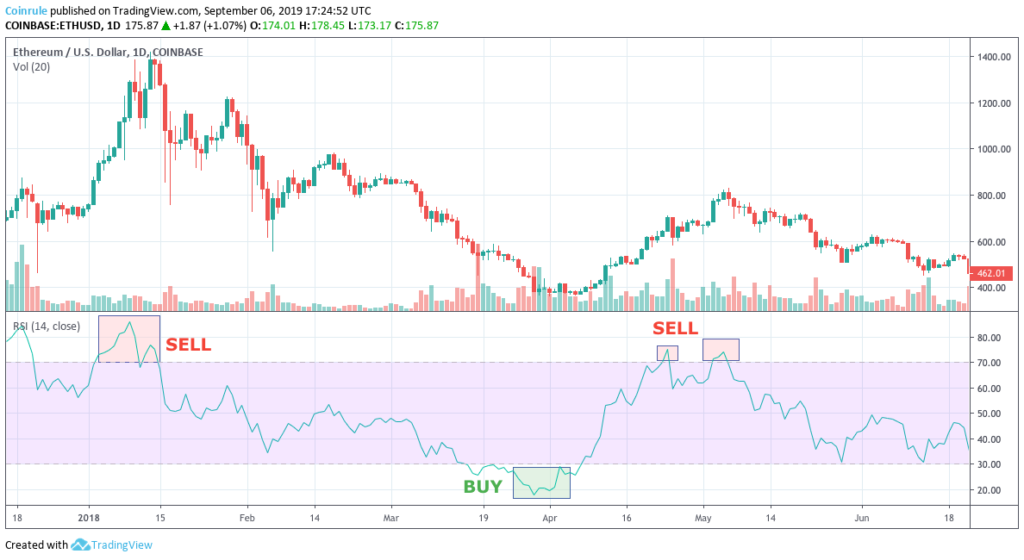
- RSI values below 30 indicate an oversold condition, suggesting a potential upward correction, while values above 70 signal an overbought condition, hinting at a possible downward reversal. Understanding these thresholds allows traders to make more informed buy and sell decisions.
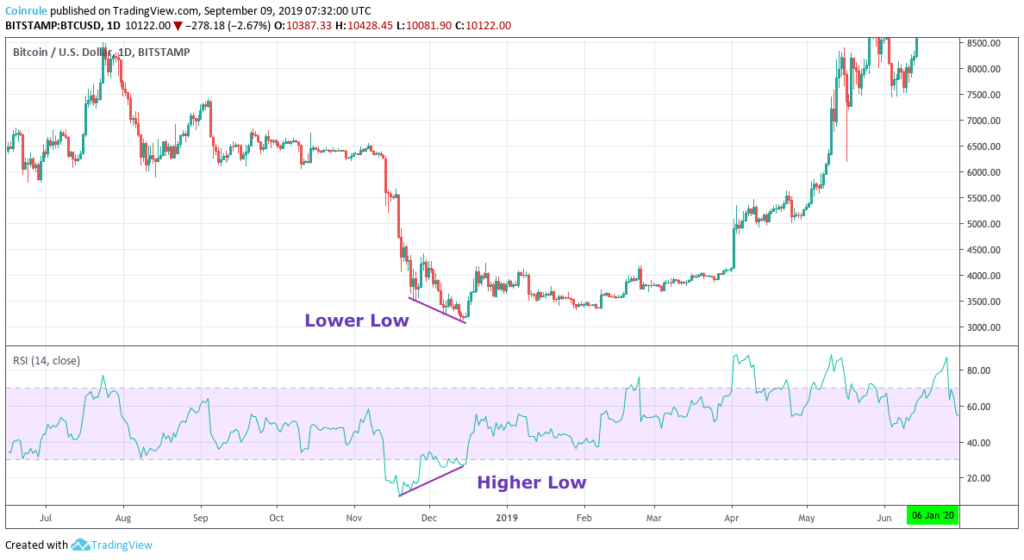
- Divergences between RSI and price action provide reliable signals of potential trend reversals. A bullish divergence occurs when the price forms a lower low, but the RSI shows a higher low, indicating a weakening downtrend. Conversely, a bearish divergence signals a weakening uptrend.
What is RSI? Understanding the Basics
The Relative Strength Index (RSI) is a widely used momentum oscillator that measures the speed and change of price movements. Developed by J. Welles Wilder, RSI helps traders identify overbought and oversold conditions in an asset, making it a key tool for technical analysis.
RSI values range from 0 to 100 and are typically calculated over a 14-period timeframe. Traders use these values to gauge whether an asset is likely to experience a reversal or continuation in its price trend.
How the Formula Works
The RSI formula compares the magnitude of recent price gains to recent price losses over a specified period. The result is a number that indicates the relative strength or weakness of an asset’s price action.
Here’s the basic formula:

Where RS (Relative Strength) is the average of gains divided by the average of losses over the given period.
This formula gives traders a clear numerical value to assess the current market conditions, helping them identify whether an asset is overbought or oversold.
How to Interpret the Values
Understanding how to interpret RSI values is crucial for making trading decisions. Here’s a breakdown of what the values mean:
-
RSI Below 30: Indicates that an asset is in an oversold condition. This suggests that the price has experienced significant downward pressure and may be due for a relief rally or upward correction.
-
RSI Above 70: Signals that an asset is in an overbought condition. This means that the price has experienced substantial upward movement and may be at risk of a reversal or downward correction.
However, while these signals are helpful, they are most effective in sideways or range-bound markets. In trending markets, relying solely on it can be misleading.

Using RSI in Different Market Conditions
RSI performs best in range-bound markets, where the price moves within a consistent range. In this scenario, traders can use it as a contrarian indicator, meaning they sell when the RSI is above 70 (overbought) and buy when it drops below 30 (oversold).
But what happens in strong trending markets?
In trending markets, the RSI may remain above 70 or below 30 for extended periods, reducing its effectiveness as a simple buy or sell signal. In these cases, traders need to look at RSI divergences for more reliable signals.
How to Spot the Divergences
The divergences occur when the price action and the RSI indicator move in opposite directions. These divergences are often strong indicators of potential trend reversals.
There are two main types of divergences:
1. Classic Divergence
-
Bullish Divergence:
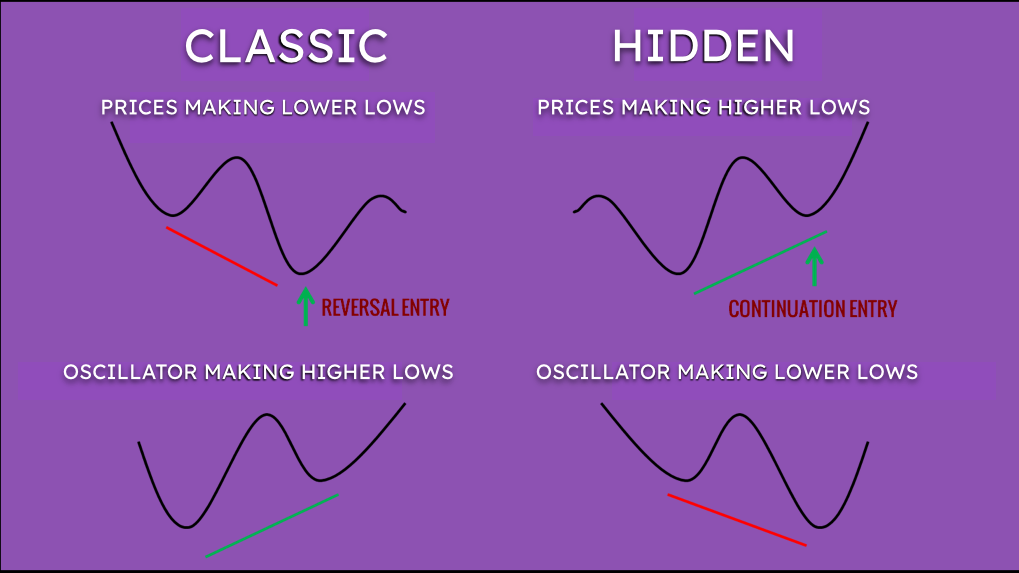
Occurs when the price makes a lower low, but the RSI forms a higher low. This indicates that the downtrend is weakening, and a reversal to the upside may be imminent. -
Bearish Divergence:
Occurs when the price makes a higher high, but the RSI forms a lower high. This signals that the uptrend is losing strength and a downward reversal could be approaching.
2. Hidden Divergence
-
Hidden Bullish Divergence:
Occurs when the price makes a higher low, but the RSI forms a lower low. This is often seen as a continuation pattern in an existing uptrend and suggests that the bullish momentum will continue. -
Hidden Bearish Divergence:
Occurs when the price makes a lower high, but the RSI forms a higher high. This indicates that the bearish trend will likely continue.
Spotting these divergences requires careful observation of both the price chart and the RSI indicator. When identified correctly, they can provide high-probability trading opportunities.
How to Get the Best Out of RSI
Using it effectively goes beyond just identifying overbought and oversold conditions. Here are some tips to maximize the indicator’s potential:
1. Combine with Other Indicators
RSI works best when combined with other technical indicators, such as moving averages or Bollinger Bands. This multi-indicator approach can provide more accurate signals and reduce false positives.
2. Look for the Divergences
Pay close attention to the divergences. These patterns often precede major trend reversals and can give traders an edge in predicting future price movements.
3. Adjust the time frame
RSI can be applied to different timeframes. Longer timeframes, like daily or weekly charts, provide more reliable signals, while shorter timeframes may offer more frequent but less accurate signals.
4. Use Dynamic Analysis
Instead of focusing solely on the values, analyze how it evolves. This can give insights into the momentum and strength of the current trend, helping traders make better-informed decisions.
How to spot divergences?
We can divide divergences into two groups, the Classic and the Hidden.
A classic bull divergence happens when the price makes a lower low, and at the same time, the indicator is posting a higher low. This pattern is usually a sound indication that the downtrend is weakening and there are good chances of a reversal. On the other hand, a price’s higher high together with an RSI’s lower high indicates that the trend is weakening and that could represent an opportunity for selling.

A hidden bullish divergence on the other hand happens when the price forms a higher low, while the RSI makes a lower low. Here is a visual recap of the main Bullish divergences, usually they represent very interesting buying opportunities.

Why it is a Powerful Tool in Crypto Trading
In crypto trading, volatility is a given. RSI helps traders navigate this volatility by providing insights into the strength of price movements. It offers a simple yet powerful way to spot potential reversals and avoid emotional trading decisions.
Additionally, platforms like Coinrule allow traders to automate RSI-based strategies, ensuring they never miss a trading opportunity, even in a 24/7 market.
Using RSI with Coinrule for Automated Trading
Coinrule is an automated trading platform that allows users to create custom trading rules based on indicators like RSI without requiring any coding knowledge.
Here’s how Coinrule enhances RSI-based trading:
- No-Code Rule Creation: Build trading strategies using RSI without any programming skills.
- Backtesting: Test your RSI strategies on historical data to ensure their effectiveness before deploying them live.
- 24/7 Automation: Automate your trading rules to monitor the crypto market round the clock.
- Risk Management Tools: Set stop-loss and take-profit levels to manage your risk effectively.
By combining the analysis with Coinrule’s automation tools, traders can improve their decision-making, reduce emotional biases, and optimize their trading strategies.
Conclusion: Mastering RSI for Profitable Trading
Understanding what is RSI and how to use it effectively can significantly enhance your trading success. While no indicator guarantees perfect results, RSI provides valuable insights into market trends, momentum, and potential reversals.
For traders looking to streamline their strategies, combining the analysis with automated tools like Coinrule can take trading to the next level. With features like no-code rule creation, backtesting, and 24/7 automation, Coinrule makes it easier to stay ahead in the fast-paced world of crypto trading.
Follow Our Official Social Channels:
